Python-Controlled Characterization of an RGB-Illuminated LDR
November 2025.
Motivation
This project was designed as a hands-on introduction to automated test design and instrument control, originally intended for LabVIEW but later migrated to Python for due to driver issues. The goal was to gain experience in developing and scripting measurement sequences, synchronizing multiple devices, and collecting repeatable data for sensor characterization — skills that directly transfer to professional test & measurement environments.
Test Setup
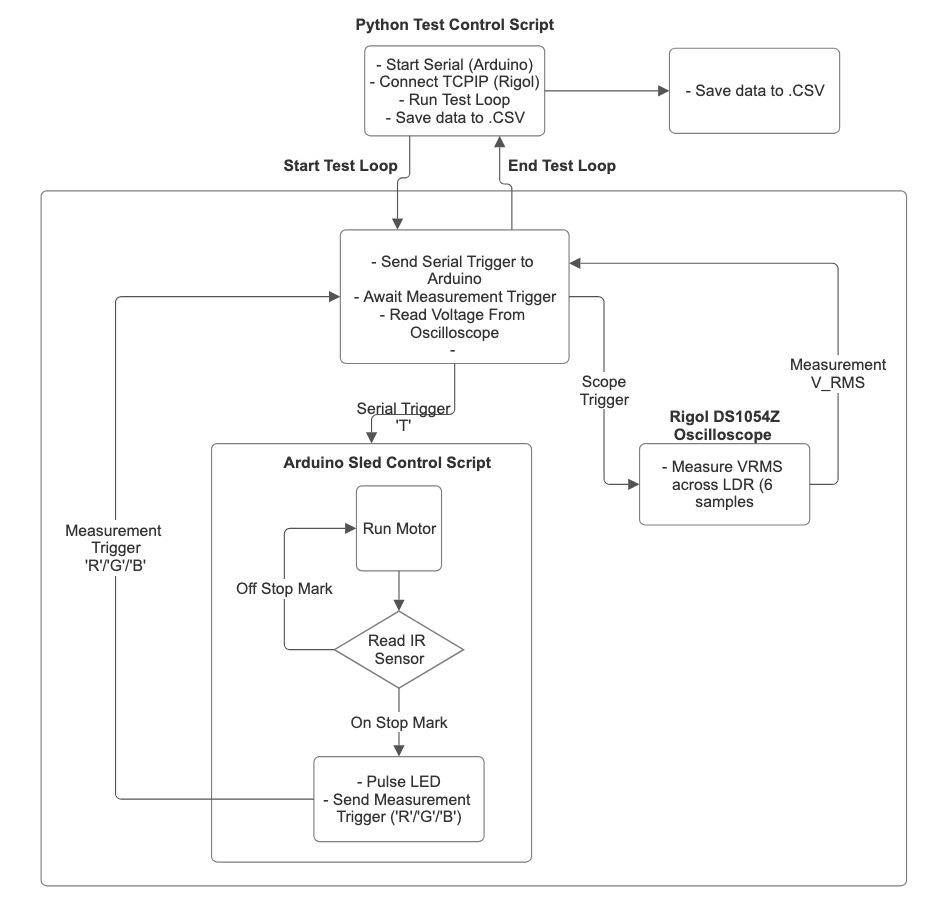
The system consists of:
- A Python master control script running on a Macbook
- Sends serial triggers to the Arduino
- Communicates with a Rigol DS1054Z oscilloscope over TCP/SCPI
- Configures the scope (High-Resolution mode, acquisition parameters)
- Logs measurements and produces summary plots and CSV files
- An Arduino sub-controller
- Responds to serial trigger ‘T’ from the PC
- Increments a linear sled carrying a light-dependent resistor (LDR) using a motor and an IR sensor
- Sequentially pulses an RGB LED (≈ 600 ms per colour)
- Prints handshake tokens (‘R’, ‘G’, ‘B’) back to the PC when each colour pulse begins
- The Rigol DS1054Z measures the voltage across the light-dependent resistor (LDR), recording its response to each colour pulse.
- The scope’s High-Resolution (HRES) mode averages samples internally, reducing noise before each reading is fetched by Python.
Pivot from LabVIEW to Python
The first iteration used LabVIEW for serial and TCP control but was limited by VISA driver compatibility with Mac.
Re-implementing in Python (with pyserial and raw SCPI sockets) offered:
- Faster iteration and debugging
- Programmatic averaging, CSV logging, and Matplotlib visualization
- Better control of timing via Arduino–Python handshake tokens
- Code portability and version control (Git-friendly workflow for future development)
Test Execution
- The Python script sends a
'T'serial trigger. - The Arduino advances the sled, then drives the Red, Green, and Blue LED channels in sequence.
- Each time a pulse begins, the Arduino prints a token (‘R’, ‘G’, ‘B’), which the Python script waits for.
- During each pulse, Python collects 6 Vpp and Vrms readings over 600 ms.
- After ten sled positions, the program writes:
- rigol_run.csv (average/median per colour and iteration)
- rigol_samples.csv (all time-resolved samples)
- rigol_plot.png (Matplotlib line plot of Vpp vs. iteration per colour)
Characterization and Computations
From the voltage measured across the LDR, several key sensor characteristics can be extracted:
- LDR Resistance
The LDR is set up in a voltage divider network with another resistor of known value. Thus, the resistance of the LDR under the different lighting conditions (colour, intensity from sled distance) can be determined via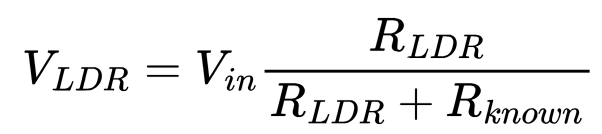
From this, we expect that the measured voltage VLDR will decrease as the sled increments toward the LED. - Relative Spectral Sensitivity
By comparing the average voltages across the LDR for each colour at each distance, we can gain an understanding of the relative sensitivity of the LDR at different wavelengths according to
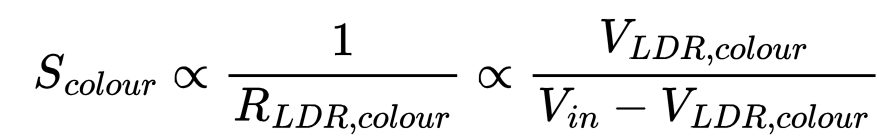
In the collected data, red pulses consistently produced larger voltages, implying greater LDR resistance and thus lower sensitivity to red light. Green gave intermediate values, and blue yielded the smallest voltage, i.e. the highest LDR sensitivity in the blue region.
This is consistent with expectations, since the blue light has the greatest energy of the wavelengths tested.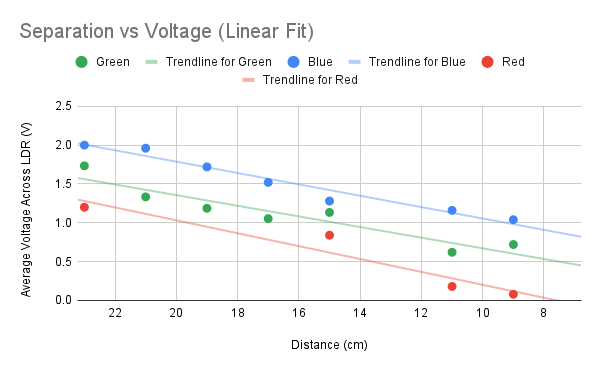
- Distance (Intensity) Dependence
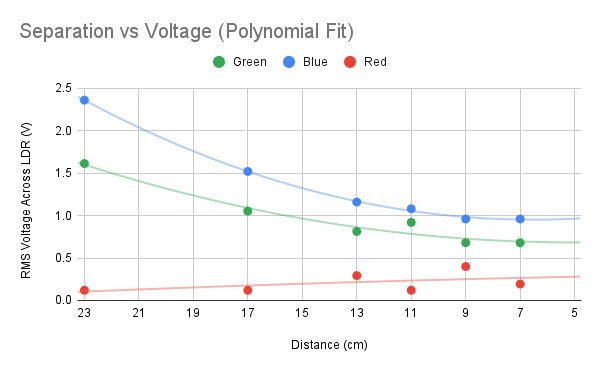
For each colour, plotting VLDR vs. sled position yields an optical attenuation curve that can be modelled by an inverse-square law, since the light dispersion cone’s base area increases with the square of it’s height (which is given by distance).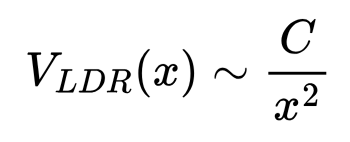
For a constant C which depends on the dispersion angle of the led. Applying a polynomial fit to the data, we can verify this relationship.
- Statistical Metrics
The software’s rolling median and trimmed mean remove outliers and enable uncertainty analysis across iterations according to the standard deviation:
Outcome
This project demonstrated a complete closed-loop test system, with
Python as the high-level experiment controller, Arduino as the timing and actuation layer, and the Rigol scope as the data acquisition front-end.
It provided practical exposure to instrument communication protocols, signal averaging, data analysis, and optical/electronic sensor characterization — all essential skills for modern test engineering.
